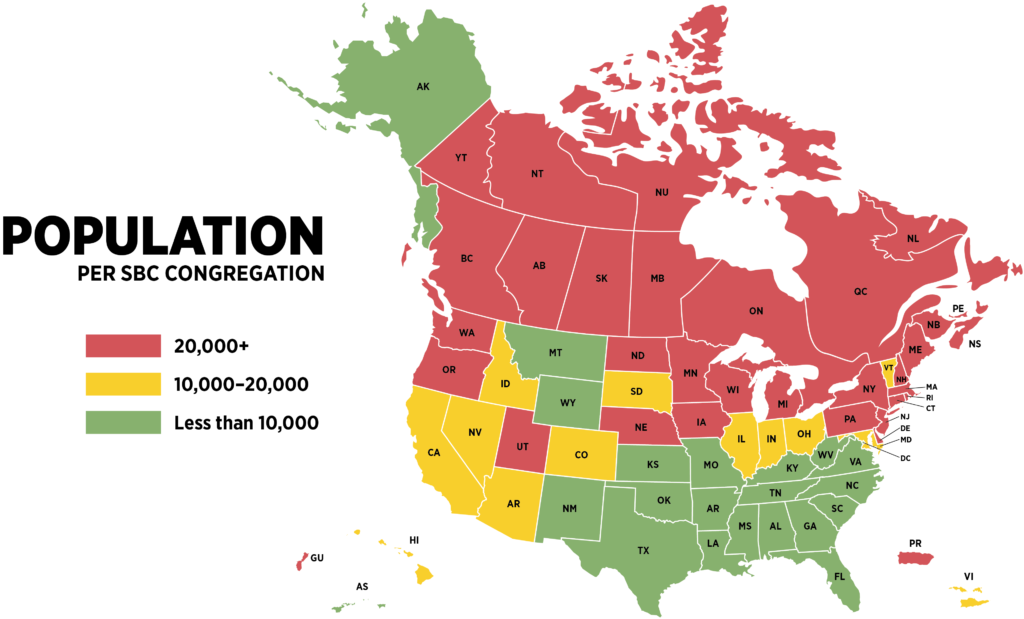
The ratio of population served by each church has slipped from 3,897 in 1900 to 6,139 in 2010. Outside of the South the numbers are even more sobering, illustrating why churches are desperately needed to reach our continent with the gospel.
Browse the table below to see ratio of church/population ratio in each state. Selected states also have a downloadable presentation graphic that will help you share how badly churches are needed across our continent
Population Key: 20,000+ | 10,000 – 20,000 | < 10,000
Region/State
|
Population per Church, 2016
|
|
|
(Southern Baptist Convention or Canadian National Baptist Convention)
|
Northeast
|
37,788
|
| Connecticut |
53,380 View Graphic |
| Delaware |
21,638 View Graphic |
| District of Columbia |
8,733 View Graphic |
| Maine |
35,986 View Graphic |
| Maryland |
9,144 View Graphic |
| Massachusetts |
40,069 View Graphic |
| New Hampshire |
43,058 View Graphic |
| New Jersey |
58,081 View Graphic |
| New York |
51,961 View Graphic |
| Pennsylvania |
37,056 View Graphic |
| Rhode Island |
62,143 View Graphic |
| Vermont |
12,747 View Graphic |
| Puerto Rico |
44,691 View Graphic |
| Virgin Islands |
10,729 View Graphic |
|
|
Midwest
|
12,802
|
| Illinois |
12,575 View Graphic |
| Indiana |
14,451 View Graphic |
| Iowa |
27,988 View Graphic |
| Kansas |
8,283 View Graphic |
| Michigan |
33,205 View Graphic |
| Minnesota |
54,117 View Graphic |
| Missouri |
3,068 View Graphic |
| Nebraska |
20,075 View Graphic |
| North Dakota |
23,686 View Graphic |
| Ohio |
15,527 View Graphic |
| South Dakota |
13,113 View Graphic |
| West Virginia |
8,031 View Graphic |
| Wisconsin |
49,816 View Graphic |
|
|
South
|
2,697
|
| Alabama |
1,481 View Graphic |
| Arkansas |
1,908 View Graphic |
| Florida |
6,821 View Graphic |
| Georgia |
2,862 View Graphic |
| Kentucky |
1,724 View Graphic |
| Louisiana |
2,858 View Graphic |
| Mississippi |
1,394 View Graphic |
| North Carolina |
2,334 View Graphic |
| Oklahoma |
2,108 View Graphic |
| South Carolina |
2,287 View Graphic |
| Tennessee |
2,109 View Graphic |
| Texas |
3,532 View Graphic |
| Virginia |
4,274 View Graphic |
|
|
West
|
16,084
|
| Alaska |
6,131 View Graphic |
| Arizona |
15,100 View Graphic |
| California |
17,499 View Graphic |
| Colorado |
13,991 View Graphic |
| Hawaii |
13,351 View Graphic |
| Idaho |
17,001 View Graphic |
| Montana |
7,838 View Graphic |
| Nevada |
14,412 View Graphic |
| New Mexico |
6,139 View Graphic |
| Oregon |
26,581 View Graphic |
| Utah |
32,460 View Graphic |
| Washington |
22,775 View Graphic |
| Wyoming |
5,684 View Graphic |
| American Samoa |
8,304 (2014) View Graphic |
| Guam |
36,173 (2014) View Graphic |
Average for U.S. and Territories
|
6,194
|
|
|
Canada
|
|
| Alberta |
77,405 |
| British Columbia |
53,279 |
| Manitoba |
105,418 |
| New Brunswick |
63,004 |
| Newfoundland/Labrador |
526,702 |
| Northwest Territories |
43,537 |
| Nova Scotia |
117,599 |
| Ontario |
233,414 |
| Nunavut |
35,591 |
| Prince Edward Island |
36,309 |
| Quebec |
185,349 |
| Saskatchewan |
52,776 |
| Yukon Territory |
36,700 |
|
|
Published October 8, 2017